Contents
Integration Broker Monitoring
The PeopleTools Integration Broker has some built in tables and pages that allow you to inspect the content of messages and respond to errors. The PeopleSoft components to view this data are broken down by:
- Asynchronous
- Overview Page: PeopleTools > Integration Broker > Service Operations Monitor > Monitoring > Asynchronous Services
- Detail Page: PeopleTools > Integration Broker > Service Operations Monitor > Monitoring > Asynchronous Details
- Synchronous
- Overview Page: PeopleTools > Integration Broker > Service Operations Monitor > Monitoring > Synchronous Services
- Detail Page: PeopleTools > Integration Broker > Service Operations Monitor > Monitoring > Synchronous Details
These components offer different functionality for asynchronous versus synchronous operations and errors. The reasons for the different functionality may not be completely obvious to someone who has not worked with Integration Broker for any length of time. We will go into detail on each monitoring component and what you can and cannot do.
Asynchronous Monitor
We are assuming you have read and understand the Asynchronous Service Operations Section especially how the contracts are created and the associated steps occur.
The Asynchronous monitor gives you a view into the Asynchronous Integration Broker tables. These tables are used to store the message data that was posted to PeopleSoft or that needs to be published to external systems. It also stores the status and state of the subscription contracts and the publication contracts. Since Asynchronous Service Operations act like a “drop box” to the integration broker this data has to be stored so they can be processed in a queue at some point in the future.
First, let’s look at the overview page for Asynchronous service operations.
You have to be very mindful when looking at this monitor and have some understanding of how asynchronous service operation work which are very different than synchronous service operations. You have to keep the following in mind.
- When an external system post to an asynchronous service operation an
Operation Instanceis created. This is the drop box. Once the data is stored the IB will respond back to the client with only an acknowledgement. - Application server processes specific the IB continually poll for new work. These processes are generally referred to as “pub/sub” by system administrators.
- If these pub/sub instance are active and the queue for the service operating is NOT paused then the pub/sub processes will inspect each
operation instance.
- If these pub/sub instance are active and the queue for the service operating is NOT paused then the pub/sub processes will inspect each
- The pub/sub processes will look at each new
operation instanceand determine if and how manypublication contractsandsubscription contractsshould be created. - Once the pub and sub contracts are created they are going to be processed at some later point based on several factors like the status of the queue, errors in the queue and the amount of work in the queue.
The status of each of these contracts has to be inspected separately in the monitor:
- Operation Instances
- Subscription Contracts
- Publication Contracts
The first tab in the component gives you a count of all the service operations in those statuses. You can click the count which will take you to a filtered view of those in the other tables on the component. This will allow you to drill into the detail which we will cover.
Operation Instances Overview
In the following screenshot, we are looking at the Operation Instances view as determined by the “queue level” drop down. This is often the least helpful view into the monitor. If everything is working properly, then you should see everything in DONE status. The only time you will see issues is if a queue is paused or the pub/subs are not active. In this latter case, those service operations will be in “new” status. I don’t often seen other statuses on this page. The publication and subscription views is where you will spend most of your time.
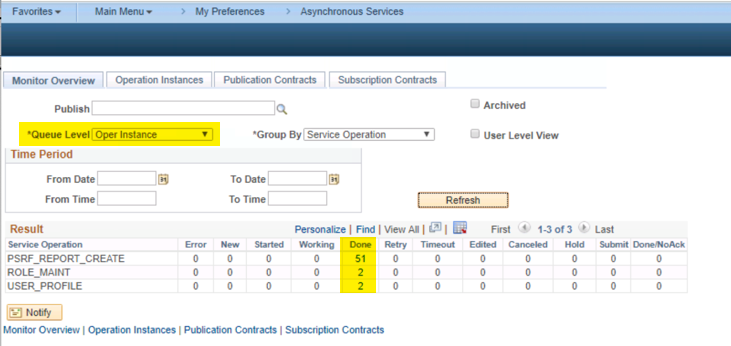
Common Operation Instance Statuses:
- New - These are new to the integration broker and have not been processed to create subscription and publication contracts yet.
- If messages never leave this status then you need to ensure the queue is not paused or your pub/sub domains are active.
- If you have a high volume operation or have some batch process creating a lot of messages you can see the operation instances have a large number of operations in new status until the application server process can catch up.
- Done - These are operation instances that have been processes and pushed to any publication or subscription contracts. Those contacts have their own status and are processed later.
- Do not get confused by this status. Operation instances in Done status do not mean the local system has subscribed to the message or that remote systems have received the message. It just means the contract has been created.
Subscription Contracts Overview
In the next screenshot, we have changed the queue level to sub contracts and this will display the summary of all the subscription contracts in the system. In this example, everything is “clean” and in done status.
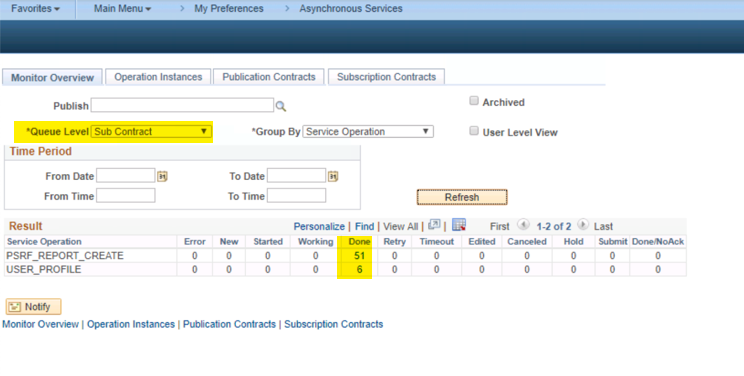
What sort of statuses would you see on a subscription contract and what can you do? Let’s go over the most common. We are going to intentionally leave a few out that are NOT common.
Subscription Contracts Common Statuses:
- Error - A subscription handler (normally PeopleCode) failed processing the message contents. The error is dependent on the handler. It could be anything from SQL, security or configuration issues. You can drill into the detail to determine the error.
- New - These are new subscription contracts that are waiting to be processed. They will eventually be processed depending on the queue partitioning setup.
- Started - These are subscription contracts that have started to process. They will not stay in this status very long.
- Working - These are subscription contracts that are actively running and processing code.
- Done - These are processed and completed contracts.
- Retry - These are contracts that were resubmitted and are retrying
- Timeout - Subscription contracts that may have hit a timeout limit. To be honest I can’t remember if I have ever seen this on a subscription contract. If you have some DB lock or infinite loop in the handler you could see this.
- Edited - If a message failed you can edit the contents of the message in the detail section. If you have done that and NOT resubmitted it, they will reflect this status.
- Cancelled - These are subscription contracts that someone cancelled. (See section below about cancelling messages.)
Publication Contracts Overview
The next screenshot has the “publication contracts” selected. In this screenshot, we have 1 in error and 2 in new. The way this queue is setup that one error will prevent all other messages from processing. It acts as a roadblock and no other messages in that queue will process until the failure is cleared.
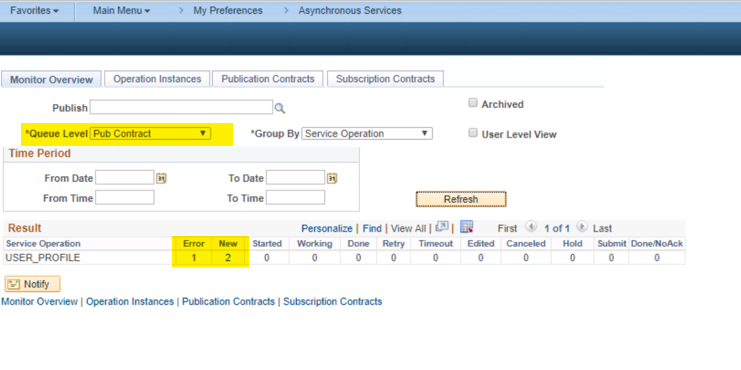
Publication Contracts Common Statuses:
- Error - A publication contract failed and could not be processes
- There could be many reasons like the receiving system is down or it rejected the message.
- If the system is temporarily down then you can easily just resubmit these.
- New - These are new publication contracts that are pending to be sent to a remote system. They will eventually be processed depending on the queue partitioning setup (TODO: Link in article).
- Started - These are publication contracts that have started to process. They will not stay in this status very often.
- Working - These are publication contracts that are actively running and contacting the external system.
- Done - These are processed and completed contracts.
- Retry - These are contracts that were resubmitted and are retrying
- Timeout - Publication contracts that may have hit a timeout limit.
- You can generally try to resubmit theses.
- Edited - If a message failed out you can edit the contents of the message in the detail section. If you have done that and NOT resubmitted it, they will reflect this status.
- Cancelled - These are publication contracts that someone cancelled. (See section below about cancelling messages.)
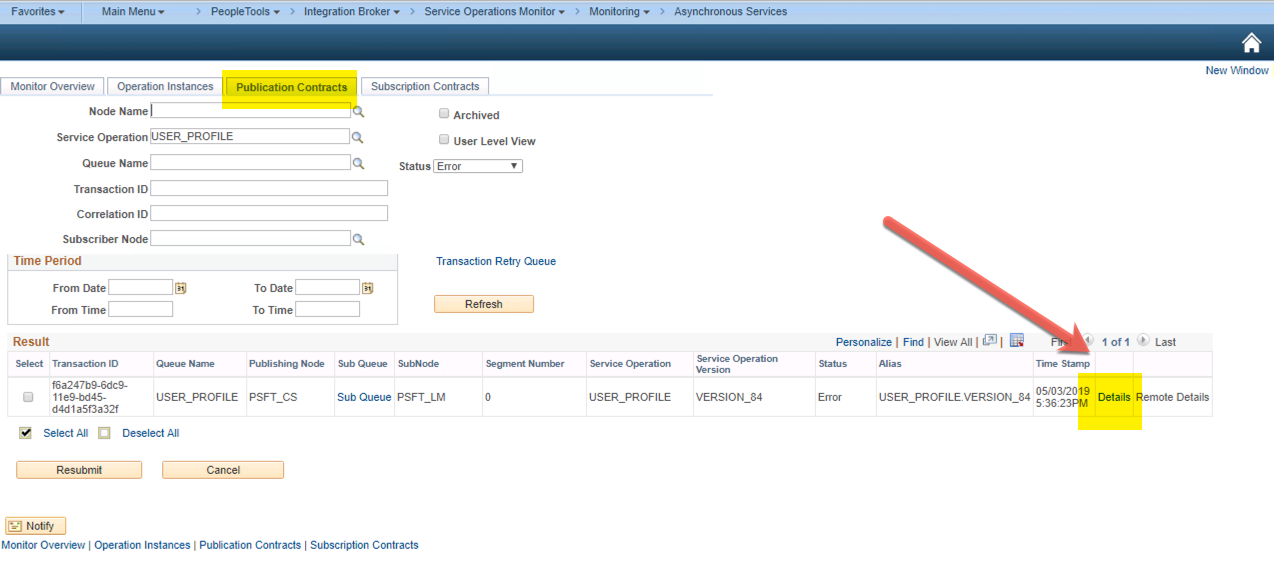
Asynchronous Details
The Asynchronous Details page allows you to view the detail on what work occurred for a particular instance of a message. If you know the GUID of the message, you can navigate straight to the detail page.
However, you will often link to the details page from the overview page. In this screenshot, we are looking at a publication contract error. By clicking the details link you will be taken to the details of that operation.
The detail page for one service operation is shown below.
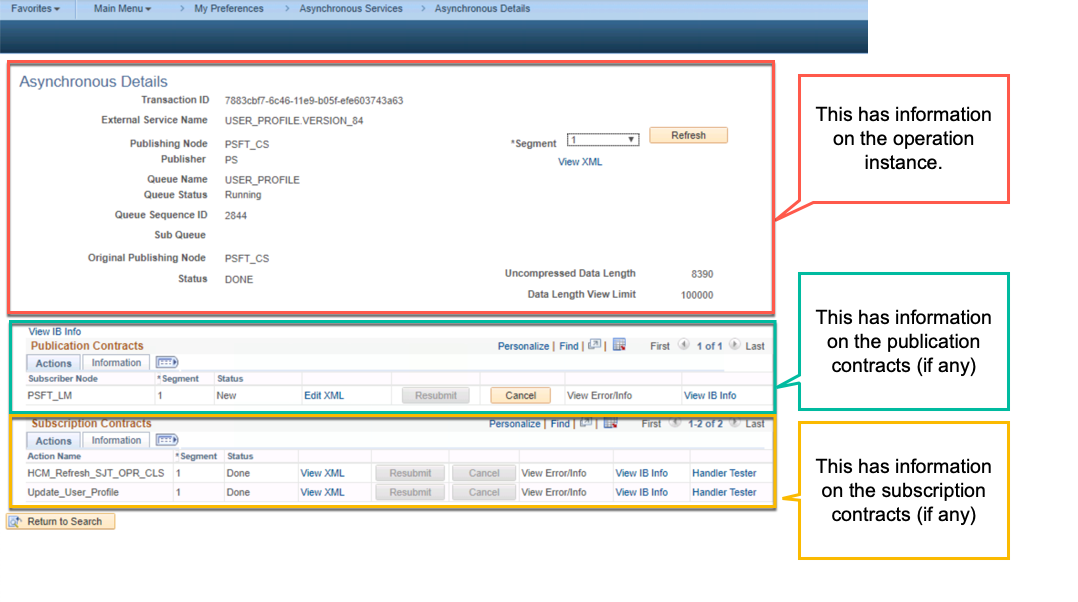
The detail page loads information about one single operation instance. This was on “post to the drop box”. Every Service Operation is setup different and every PeopleSoft institution does something different with their publications. Let’s look at our example and see what we can see about this operations.
- The top section I highlighted in red, is information about the Operation Instance.
- You can view the raw XML (or other payload) that was posted into the service.
- You can also view the operation instance status.
- This red section is normally not very useful because operation instances are just the drop box. The real work gets done on the publication and subscription contracts.
- The section I highlighted in green, are the publication contracts.
- If the operation does not have any contracts this grid will be hidden. Additionally, if the pub/subs are down or the queue is paused the publication contracts have not been created yet. So this grid will NOT be visible.
- There will be one row for every publication that needs to occur. In this screenshot, there is only one node that is going to receive this message. If you had your system setup to publish to 5 different nodes, there would be 5 rows there.
- If the publication was in a failure status, you can drill into the details here to view the error message.
- The section in yellow are the subscription contracts.
- If the operation does not have any contracts this grid will be hidden. Additionally, if the pub/subs are down or the queue is paused the subscription contracts have not been created yet. So this grid will NOT be visible.
- An operation can have any number of subscription contracts. You generally just see one for inbound integration. However, there are many use cases where you may want more than one subscription handler to trigger. This screenshot shows where there are 2 handlers running.
- If one of the subscription handlers was in a failure status, you could view the messages here. There are many times that the errors messages can be extremely vague from many of the delivered handlers especially if they are doing updates with component interfaces.
Synchronous Monitor
The Synchronous monitor has limited functionality. Remember that the interaction with a synchronous is real-time. If there is a failure, then the failure is reported back to the client in real time. That attempted interaction is done and it cannot be recreated.
- There is nothing for an Administrator to do to take action on Synchronous errors. There are more for later logging or troubleshooting a client sending in “bad” requests. If the message is in ERROR, there the only thing you can do is “archive” the message.
- Additionally, most Synchronous service operations do NOT have logging turned so you will often not see anything on the monitor even though you may be pushing thousand of synchronous operations.
- The routing configuration of the operation controls if the header and/or the body is logged.
- Failures are always logged.
The overview page is here:
When you drill into the detail you will get here:
This page allows you to view the inbound message as well as archive it.
Cancelling Asynchronous Messages
If you do not have this knowledge then be very wary of cancelling messages on the subscription queue. If another message comes in behind that message for the same piece of data it can cause data corruption as generally messages need to process in order. If you cancel a message it will “release” the other messages to process. In some service operations there is no way to reproduce the message again in the publishing database if you cancel the message. In other cases it can be trivial to produce the exact same message again.
PeopleTools tables
Here are a listing of PeopleTools tables involved in the IB.
- PSAPMSGPUBHDR
- PSAPMSGPUBDATA
- PSAPMSGPUBCON
- PSAPMSGSUBCON
- PSAPMSGPUBERR
- PSAPMSGPUBERRP
- PSAPMSGPUBCERR
- PSAPMSGPUBCERRP
- PSAPMSGSUBCERR
- PSAPMSGSUBCERRP
- PSAPMSGPCONDATA
- PSAPMSGSCONDATA
- PSIBERR
- PSIBERRP
- PSIBDEBUGLOG
- PSAPMSGIBATTR
- PSIBAEATTR
- PSAPMSGDOMSTAT
- PSAPMSGDSPSTAT
- PSIBLOGHDR
- PSIBLOGDATA
- PSIBLOGERR
- PSIBLOGERRP
- PSIBLOGIBINFO
Troubleshooting
- All operations are in “NEW” Status"
- Make sure the queues are not paused
- Make sure the pub/subs are active. See the Administration Section
- I am not seeing anything in the Subscription contracts for a message that as posted.
- Make sure your handlers are active and make sure you have inbound or local to local routings.
- I am not seeing the message get into the publication contracts
- Make sure your publication contracts are active
- I am not seeing any messages in the Synchronous monitor
- The service operation does not have any logging turn on. Check the routing to ensure there is at least header logging
Related Links
- UMN has a custom Integration Broker monitoring process on GitHub
Chris Malek
Chris Malek is a PeopleTools® Technical Consultant with over two decades of experience working on PeopleSoft enterprise software projects. He is available for consulting engagements.
Work with ChrisPeopleSoft Simple Web Services (SWS)
SWS turns SQL into production REST APIs — ready for AI, modern apps, and partner integrations. One install, unlimited potential.
- Configuration-driven, no coding required
- JSON, XML, and CSV output
- Works across all PeopleSoft pillars
- Built on 25+ years of PeopleSoft expertise
PeopleSoft Simple Web Services (SWS)
A powerful PeopleSoft bolt-on that makes REST web services easy. You bring the SQL, SWS handles the rest.
- Go from idea to production in minutes
- Zero code migrations after install
- JSON, XML, and CSV output supported
- No PeopleCode or Integration Broker expertise required
PeopleSoft Simple Web Services (SWS)
Traditional PeopleSoft web services cost $3,600–$13,000 each to develop. SWS deploys production REST APIs in under 5 minutes through configuration alone.
- No PeopleCode or Integration Broker expertise required
- Works across Campus Solutions, HCM, and Financials
- Built-in pagination, caching, and nested data structures
- Trusted by institutions across higher education and government
PeopleSoft Simple Web Services (SWS)
Turn PeopleSoft data into clean REST APIs for AI integrations, modern applications, and vendor data feeds. Configuration-driven — no PeopleCode required.
- Deploy production APIs in under 5 minutes
- AI and LLM ready (RAG, chatbots, intelligent search)
- JSON, XML, and CSV output
- Zero modifications to delivered PeopleSoft objects